Why GPU observability on Kubernetes requires custom engineering
Kubernetes lacks native per-pod GPU metrics, forcing platform teams to build custom visibility for the most expensive infrastructure line item.
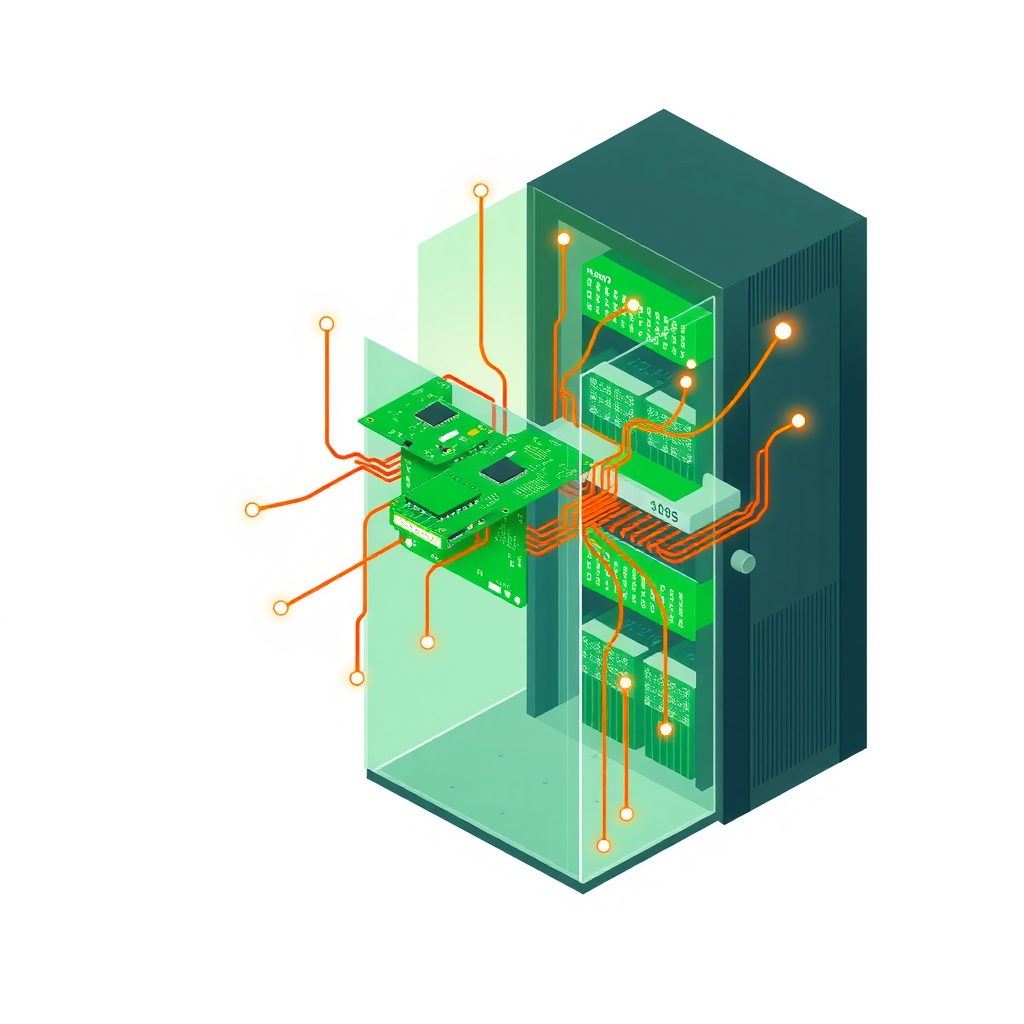
Running AI workloads on Kubernetes reveals a stark contrast between CPU and GPU management. While CPU and memory usage come with built-in per-pod metrics and cost attribution, shared GPUs offer none of this out of the box. As of October 2026, platform engineers must manually reconstruct visibility for their most costly infrastructure component.
What happened
For years, Kubernetes users have relied on standard dashboards to track resource consumption. These tools compare what a container requested against what it actually used, allowing teams to identify waste and allocate costs by namespace. This model works seamlessly for CPU and memory because the kernel tracks usage per container automatically. However, this established workflow breaks down completely when applied to Graphics Processing Units (GPUs).
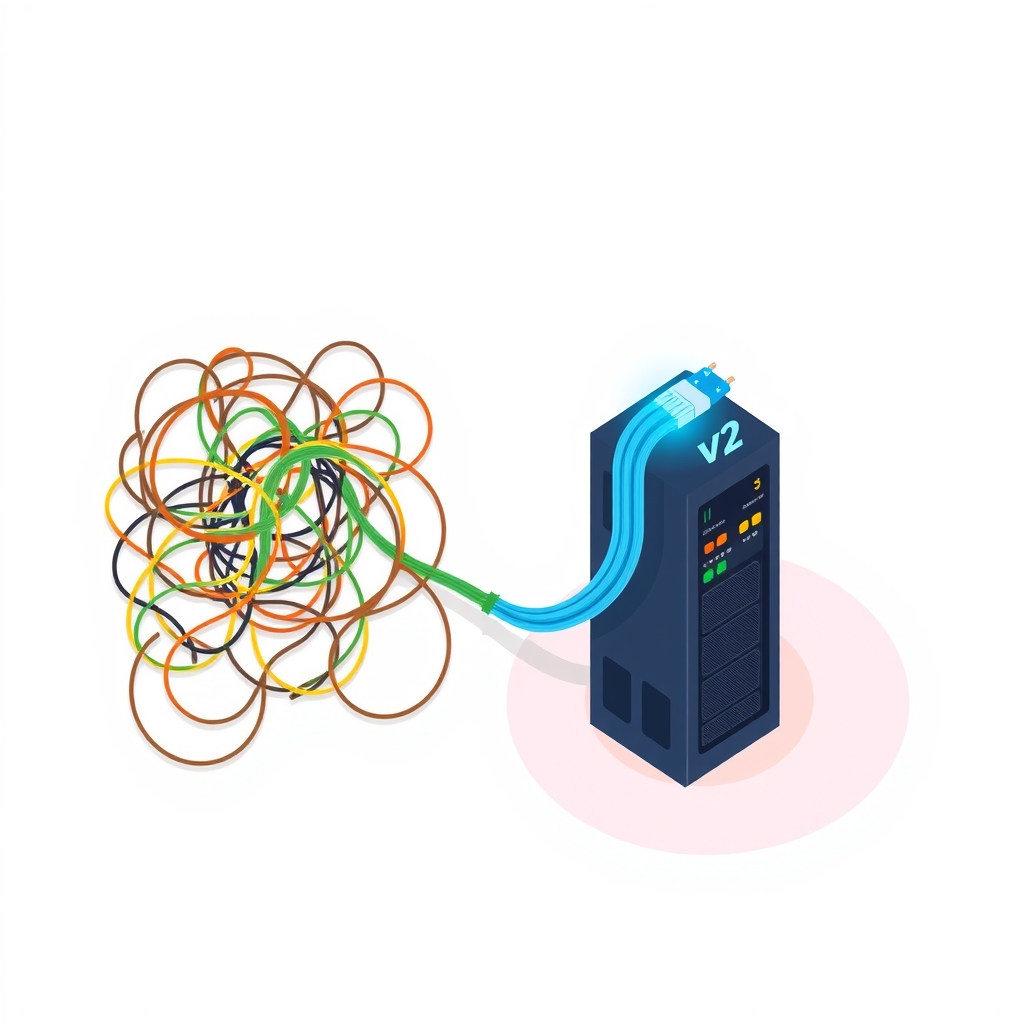
When workloads move to GPUs, the assumptions that hold true for other resources no longer apply. Platform teams find themselves rebuilding every layer of visibility from scratch. They must create their own metrics, define their own accuracy standards, and invent rules for splitting bills. This manual effort is particularly painful because GPU costs represent the largest expense in modern AI infrastructure budgets.
How it works
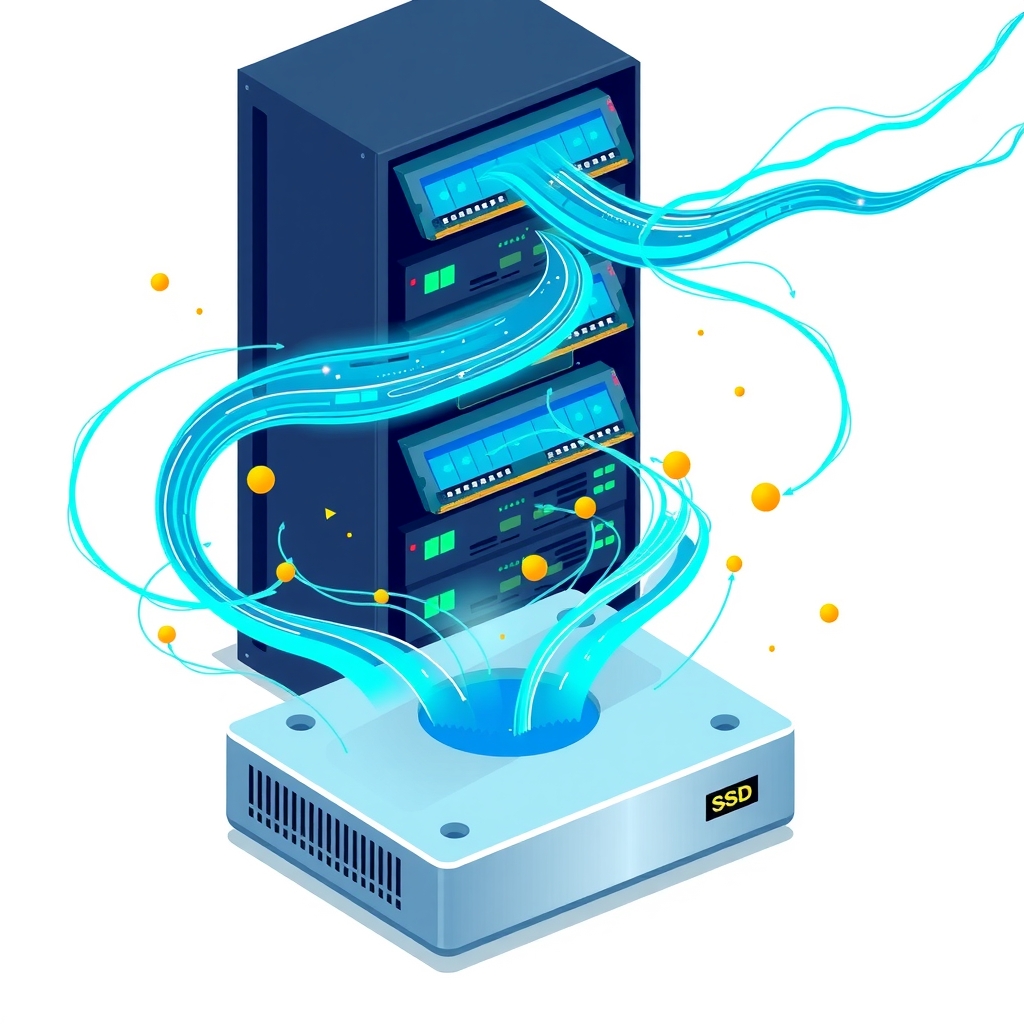
The core issue lies in how GPU metrics are exposed. Tools like NVIDIA’s DCGM exporter report data at the physical device level by default. This approach works when a single pod owns an entire GPU. However, when multiple pods share a GPU through time-slicing or Multi-Process Service (MPS), the exporter assigns the same total usage value to every pod. If three pods share one GPU, each appears to use 100% of the device, resulting in a nonsensical 300% total utilization figure. The driver exposes only a single set of counters for the whole GPU, making it impossible to distinguish individual workload consumption.
Rightsizing also becomes complex. Unlike CPUs, which support millicores and overcommitting, GPUs are typically requested as whole units. Fractional sharing happens below the scheduler via time-slicing or Multi-Instance GPU (MIG) partitions, meaning Kubernetes requests do not align neatly with actual usage. Furthermore, GPU utilization metrics are ambiguous. A GPU may show 100% utilization while performing minimal compute work, as frameworks often reserve most memory at startup. Memory usage remains the most reliable metric for attribution, as compute time is difficult to measure accurately in concurrent environments.
Key details
- NVIDIA’s DCGM exporter reports at the device level, causing inflated usage numbers when GPUs are shared across multiple pods.
- GPU requests in Kubernetes are whole-number resources, preventing the overcommitting and bursting strategies common with CPUs.
- The
NVIDIA_VISIBLE_DEVICESenvironment variable can allow pods to access all GPUs on a node if not properly overridden by the device plugin. - Compute utilization metrics are unreliable for shared workloads, as they indicate activity rather than proportional resource consumption.
- Memory usage is the most accurate signal for cost attribution, though it does not account for driver-reserved memory slices.
- Cloud providers bill GPU nodes as single line items, requiring manual decomposition to assign costs to specific models or teams.
Why it matters
For software builders, the lack of native GPU observability translates directly into engineering toil and financial opacity. Teams cannot simply adopt their existing CPU monitoring playbooks. Instead, they must invest significant time building custom tooling to track usage, enforce guardrails, and split costs. This diverts resources from product development to infrastructure maintenance. Without accurate data, organizations risk overprovisioning expensive hardware or failing to charge back costs to the correct teams, leading to budget inefficiencies.
The complexity extends to technical architecture decisions. Different sharing paradigms, such as time-slicing, MPS, and MIG, change the underlying math for resource allocation. Dynamic Resource Allocation (DRA) is maturing in Kubernetes, but the ecosystem, including autoscalers, is still catching up. Engineers must understand which sharing mode their nodes use to interpret metrics correctly. Misinterpreting these signals can lead to incorrect scaling decisions and performance bottlenecks.
What you can do
- Audit your current GPU monitoring setup to identify if metrics are inflated due to shared device reporting.
- Prioritize memory usage metrics over compute utilization for cost attribution and chargeback models.
- Verify that the NVIDIA device plugin correctly overrides the
NVIDIA_VISIBLE_DEVICESenvironment variable in all pods. - Evaluate Dynamic Resource Allocation (DRA) features in newer Kubernetes releases for improved resource management.
- Develop custom scripts to decompose cloud provider bills and weight GPU costs by specific hardware models.
- Establish clear definitions of utilization relevant to your specific AI workloads, such as memory footprint or bandwidth.