Amazon CloudWatch adds GPU and accelerator visibility for EKS clusters
AWS launches accelerated compute insights to provide device-level observability, cost waste detection, and automated remediation for GPU and AI accelerator workloads on Amazon EKS.
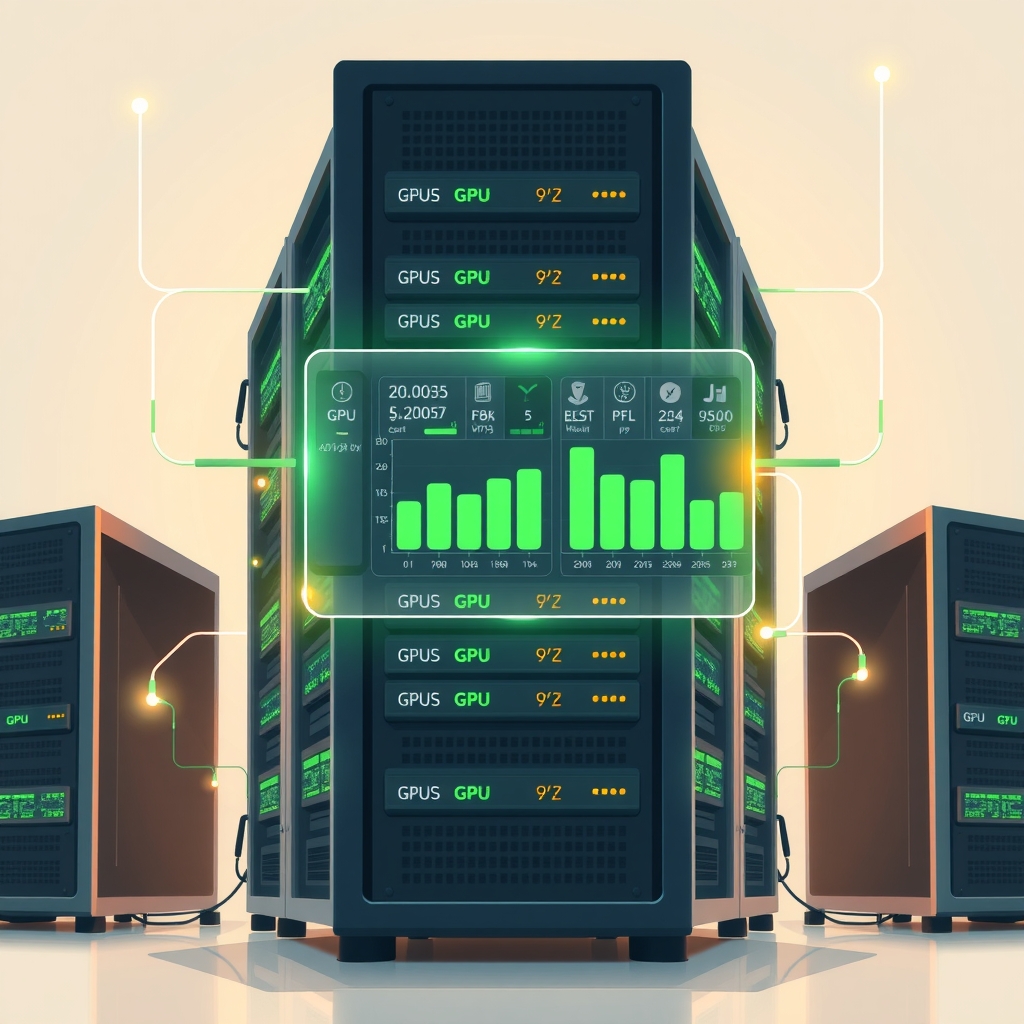
Amazon Web Services has introduced Amazon CloudWatch accelerated compute insights, a new capability designed to bring granular visibility to GPU and AI accelerator usage within Amazon Elastic Kubernetes Service (EKS) clusters. Launched at KubeCon North America 2026, this tool addresses the growing operational blind spots that platform teams face when managing expensive, shared accelerator fleets.
What happened
Accelerators such as GPUs have become the most costly component in modern infrastructure budgets, yet many organizations lack the visibility needed to manage them efficiently. In shared cluster environments, platform teams often struggle to identify which teams or workloads are consuming specific resources, leading to inefficient utilization and unexpected costs. When performance degrades due to hardware faults or thermal throttling, teams frequently discover the issue only after a job fails or the monthly bill arrives, forcing them to restart entire instances rather than isolating individual faulty devices.
To solve this, AWS released accelerated compute insights, which provides a unified operational view of every accelerator in an EKS fleet. The service supports NVIDIA GPUs, AWS Trainium, and AWS Inferentia, normalizing metrics from these different hardware types into a common schema. This allows teams running mixed fleets to monitor health, utilization, and cost waste from a single dashboard without needing separate tools for each hardware vendor.
The launch builds on a series of observability updates AWS has rolled out for EKS throughout 2025 and 2026, including OTel Container Insights and Application Performance Monitoring. By adding accelerator-specific telemetry to this existing stack, AWS aims to close the gap between infrastructure monitoring and application performance for AI workloads.
How it works
The system operates by converging collection paths at the CloudWatch Metrics API. For NVIDIA GPUs, the CloudWatch agent and NVIDIA Exporter collect device-level metrics, while a Unified Accelerator Health Layer normalizes data from both GPUs and Inferentia chips. This normalized data is ingested into CloudWatch’s centralized storage via the OpenTelemetry (OTLP) endpoint, requiring no per-node setup or custom collection pipelines from the user.
Once the data is flowing, the service enriches accelerator metrics with Kubernetes metadata, including pod, namespace, node, and custom labels such as team or application name. It automatically detects Multi-Instance GPU (MIG) partitions and other resource allocation schemes like Kubernetes Dynamic Resource Allocation (DRA). This context allows the system to attribute utilization and memory usage to specific workloads, enabling precise tracking of who is using what resources.
For troubleshooting, the tool integrates with CloudWatch Omni and the AWS DevOps Agent. Omni provides an application-centric view, linking inference workload performance directly to accelerator health. The DevOps Agent can analyze telemetry, logs, and recent changes to distinguish between failure modes, such as a memory error requiring hardware replacement versus a driver issue solvable by a restart. It then presents an evidence-backed action plan for approval or, if configured, executes remediations automatically.
Key details
- Supported Hardware: The service supports NVIDIA GPUs, AWS Trainium, and AWS Inferentia, with metrics normalized into a single Accelerator Health view.
- Waste Detection: It identifies three types of recoverable waste: right-sizing opportunities, training efficiency gaps based on tensor core utilization, and inference endpoints operating below hardware capacity.
- Kubernetes Integration: Accelerator data is enriched with pod, namespace, and node metadata, and it auto-detects MIG partitions and DRA schemes without manual configuration.
- Automated Remediation: The AWS DevOps Agent can diagnose root causes and propose or execute fixes, such as restarting drivers or replacing nodes, based on predefined runbooks.
- Installation: Users enable the feature by installing or upgrading the Amazon CloudWatch Observability EKS add-on to version 7.0.1 or higher via eksctl, Helm, or Terraform.
- Cost Context: Cost figures provided are operational estimates to guide decision-making, not authoritative billing data, which remains available through AWS Cost Explorer.
Why it matters
For software engineers and infrastructure leads, the primary value lies in shifting from reactive firefighting to proactive optimization. Previously, a single failing GPU might force a team to cycle an entire eight-GPU instance, wasting healthy resources and waiting for scarce capacity to return. With device-level visibility, teams can isolate and replace only the faulty hardware, maintaining uptime for the rest of the workload. This precision reduces downtime and prevents the cascading delays that often plague large-scale training jobs.
Furthermore, the ability to correlate hardware telemetry with application performance helps developers optimize their code. By identifying inference endpoints that are underutilized or training jobs with low model flops utilization (MFU), teams can adjust configurations to get more value from their existing hardware. This is critical as accelerator costs continue to rise, making efficiency a key lever for controlling infrastructure spend without sacrificing performance.
What you can do
- Upgrade your Amazon CloudWatch Observability EKS add-on to version 7.0.1 or later to enable accelerator data collection.
- Install the add-on using eksctl or Helm commands provided in the AWS documentation to start streaming OpenTelemetry data immediately.
- Open CloudWatch Omni to view your inference workloads alongside accelerator health metrics and identified waste categories.
- Review the Accelerator Health view to identify specific pods or namespaces consuming disproportionate resources or experiencing errors.
- Configure the AWS DevOps Agent to receive health events and test its diagnostic capabilities on non-critical workloads before enabling automated remediation.
- Use the cost waste estimates to identify right-sizing opportunities for training jobs that are over-provisioned relative to their actual hardware usage.